


In a recently published article, I insisted bitcoin was going to make a move in 2020. Now, there’s no doubt. Every technical indicator indicates we are in a bullish trend and the virtual currency media is getting excited!
Chart Analysis
Let’s check the charts! Starting with the daily chart …
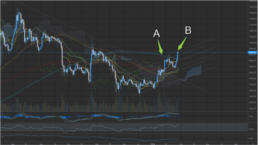
A: We’ve crossed the 200-day moving average, signaling the beginning of a long-term rally.
B: From a short-term perspective, the deviation of the Ichimoku Cloud Equilibrium Tenkan-sen (conversion line) from the reference line (Kijun), the shorter-term moving averages all turning positive, and bitcoin now approaching a new trend line (indicated on the graph as B) after three strong up days in a row are all looking positive.
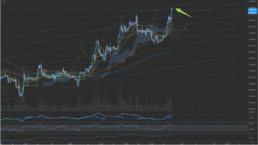
Even in the 4-hour chart, you can see increasing deviation of various momentum indicators such as the moving average and the Ichimoku Cloud conversion line. Additionally, we are also approaching another new trend line (see green arrow above).
It is important to always remain unemotional when studying the market.
I’ve talked about my trading strategies in a previous article, but right now, I’m closely watching;
1) A public excited about the recent move of bitcoin,
2) How quickly the price of bitcoin is deviating from various moving averages and indicators.
What if the price of bitcoin continues to sharply rise with no big correction?
I’ve already made a lot of money from around $ 8,500. The first rule of trading is to strictly stick to your own trading strategy rules. Follow this first rule of trading and you’ll never run into serious problems.