


Relax! The long-term bull trend is still intact.
Deleveraging
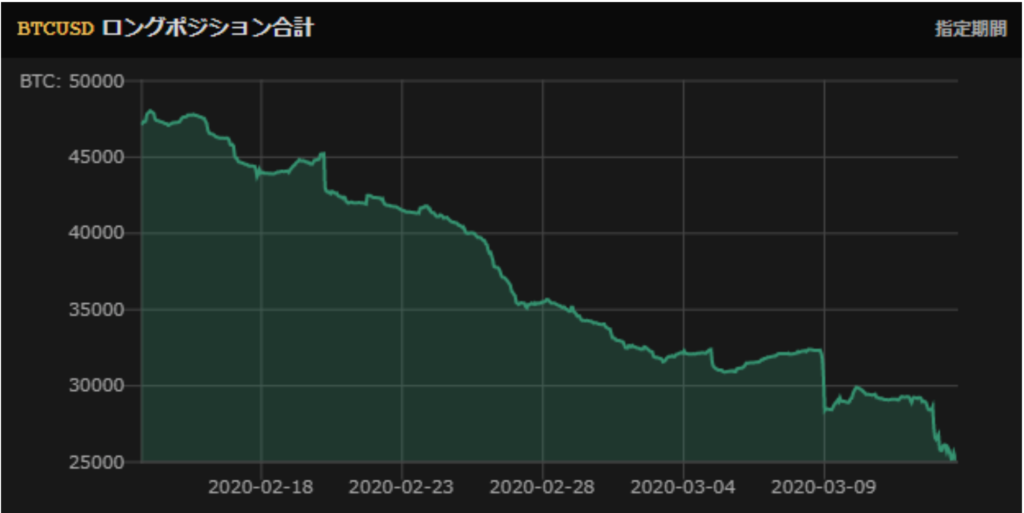
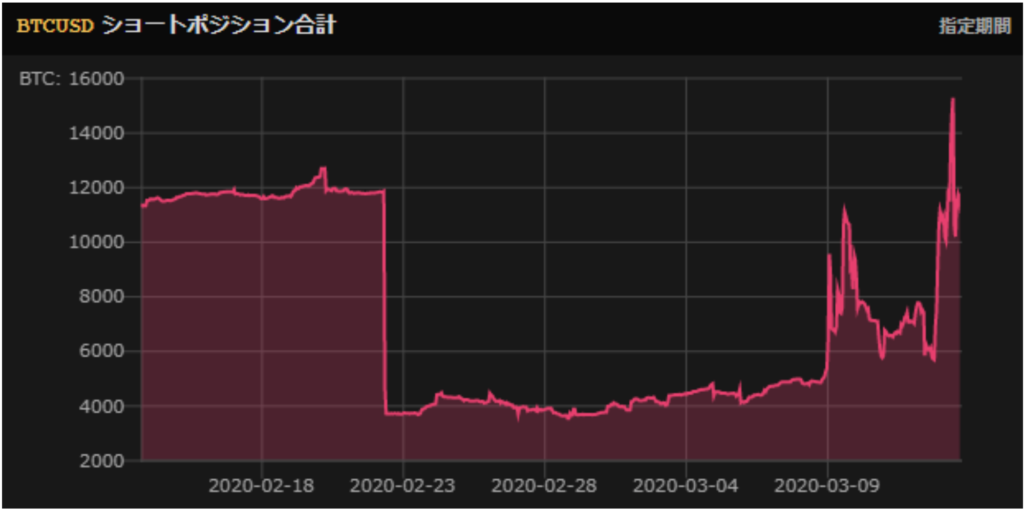
There are a lot of leveraged players in this space and we just witnessed a sudden deleveraging movement. Bitmex longs evaporated and so did price support. Never-the-less, we continue to believe the vast majority of bitcoin holders are long-term hodlers.
Long-term trajectory is still intact
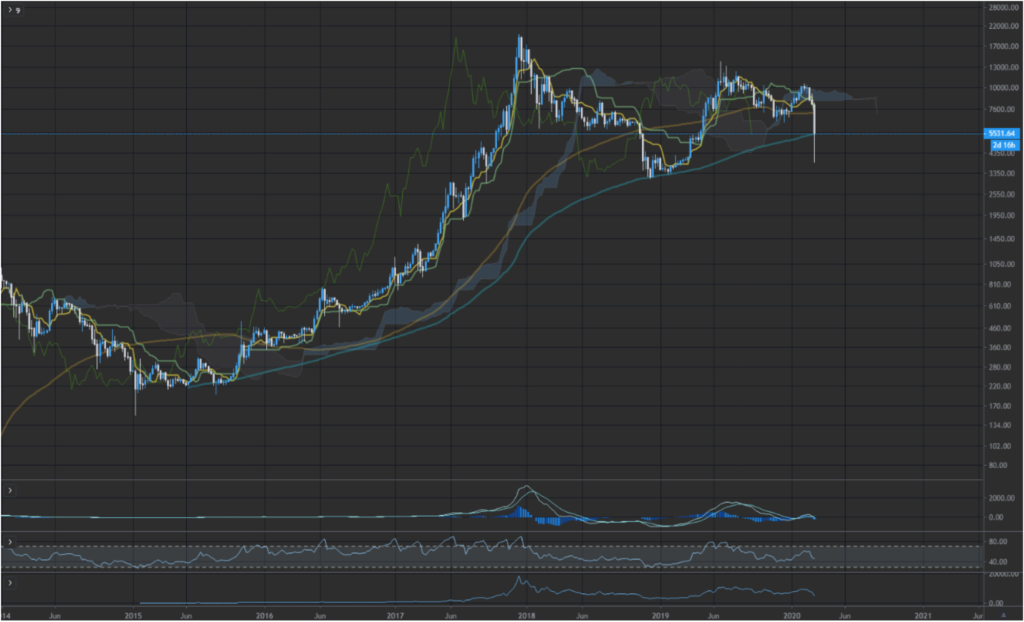
Looking at the weekly logarithmic chart. Although we briefly wicked through the critical 200-day moving average, BTC bounced back.
Check the weekly log chart below. As you can see, we momentarily broke the 200-week moving average (a strong long-term support line) before recovering above it.
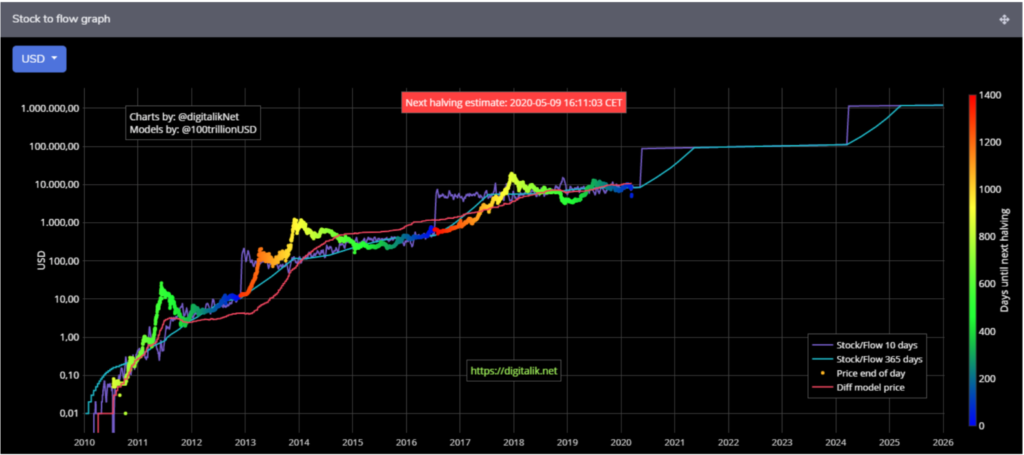
The expected price movement in the Stock to Flow chart
Below is the Bitcoin Stock to Flow chart – as you can see, it is falling as expected. I will write a separate article on how to interpret the Stock to Flow chart.
We continue to believe bitcoin’s price will rebound from here. However I’m curious to see how Xbit interprets all of this market action. Let’s see what happens over the next couple of days!